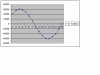
...although I do not like their waveforms much -- they look too distorted, especially the voltage one (http://www.ladyada.net/make/tweetawatt/software.html). The dimmer voltage is unreal -- there is no way the 120V mains sine wave can be distorted so much ! Something is wrong.
they are only sampling the A/D once every ms, that is why it is as distorted as it is